One measure of effectiveness can be seen in the Watched Events graph, which compares the responses that the email has produced in relation to the number of responses projected by a certain date at the email’s launch. In this way you can tell whether the email is meeting its desired targets.
Watched Events are set up in the iAPPS Analyzer module. Your iAPPS Marketier installation must include the iAPPS Analyzer module for you to be able use Watched Events to track the effectiveness of an email.
You can access the Watched Events graph page from either the:
- Marketier Control Center: Right-click on an email in the Watched Events container and select View Watched Events.
- Emails screen: Right-click on an individual email in the Emails listing and select View Watched Events.
A Watched Events graph will appear:
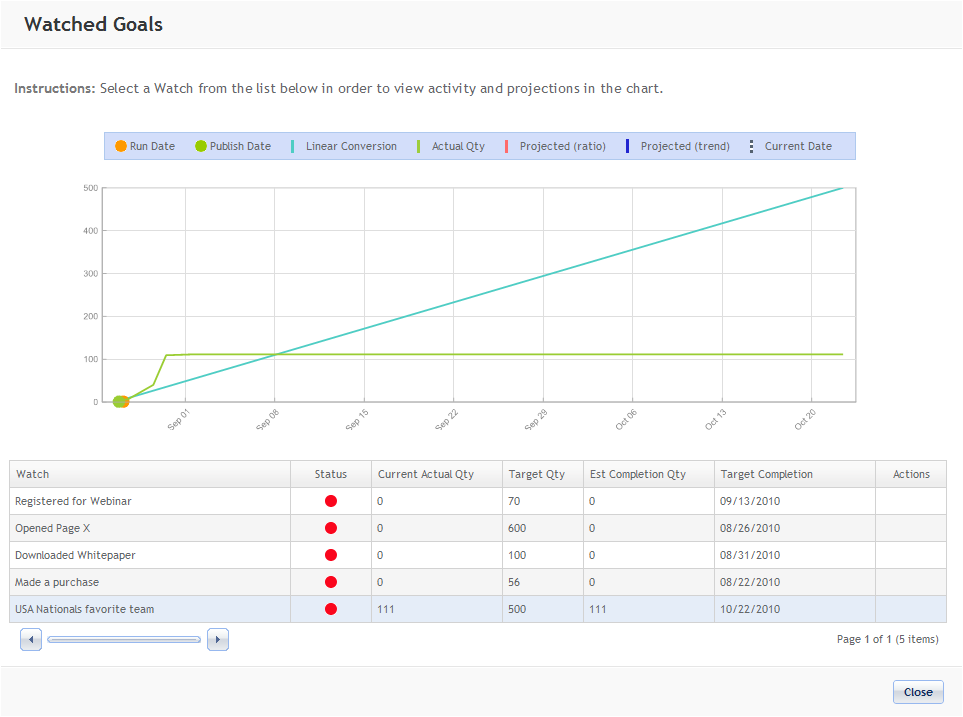
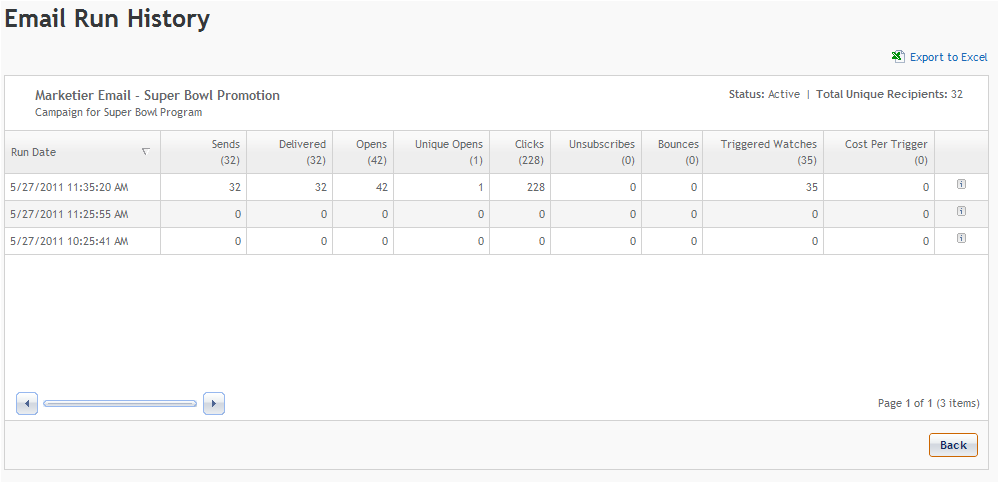
To view specific activity and projections, left-click on a Watched Event from the list defined for this email at the bottom of the page.
This Watch list at the bottom of the page has additional information.
| Column | Displays | |
|---|---|---|
|
Watch |
Name of Watched Event. |
|
|
Status
|
Color-coded display that displays projected results in relation to target goal. |
|
|
Green |
Projected quantity more than 10% above conversion goal. |
|
|
Yellow |
Projected quantity +/- 10% from conversion goal. |
|
|
Red |
Projected quantity more than 10% below conversion goal. |
|
|
Current Actual Qty |
Displays number of responses received to date. |
|
|
Target Qty |
Displays quantity of responses targeted |
|
|
Est Completion Qty |
Quantity of responses at completion of campaign projected from current actual quantity. |
|
|
Target Completion |
Displays target completion date. |
|
The Watched Events graph displays the following:
|
Graph Element |
Displays |
|---|---|
|
Y axis |
Number of conversions. |
|
X axis |
Date. |
|
Green Dot |
First date on which email was sent. A green dot appears each time email is sent after being edited. |
|
Orange Dot |
If email set for multiple mailings and email is not edited between sends, indicates each time after first mailing that email is sent out. Each time an email is edited and then sent, Marketier resets the mail sent count to 0, as Marketier counts an edited email as a new email. |
|
Aqua Line |
Linear conversion; amount of conversions per day when calculating total number of conversions as occurring at a steady rate each day. |
|
Green Line |
Actual conversions. Allows you to visually see where results are tracking in relation to linear conversion rate (aqua line). |
|
Red Line |
Projection of email results from current date to end date based on historical trends. |
|
Blue Line |
Projection of email results from current date to end date based on historical ratios. |
|
Dotted Line |
Current date. |
When you are finished viewing the Watched Events graph, click “Close”.