Traffic reports provide statistics regarding the pages most frequently visited. The traffic tab is accessible through the Site Analytics > Traffic menu item. Alternatively, you can select the tab in the Site Analytics Reports screen.
Traffic reports include:
Overview is the default view for Traffic Reports. Overview statistics provides summary information on:
To get full reports, click the “View Full Report” link next to the report name:

When you right click on any of the page names in of the summary reports above, you get options to view more information about the page.
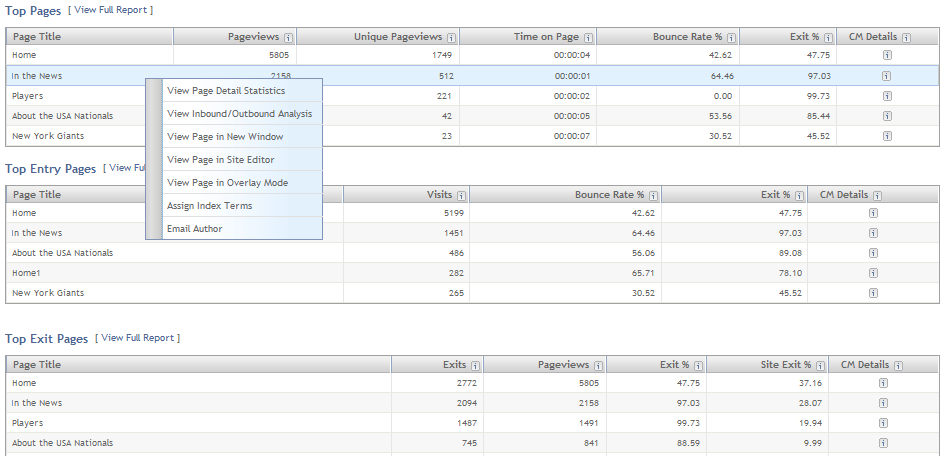
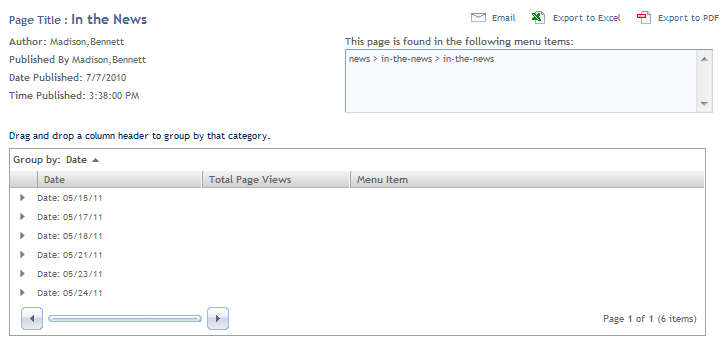
Choosing View Page Detail Statistics will bring up a popup window with key statistics. You can email the statistics or export them to an Excel or PDF file.
View Inbound/Outbound Analysis will take you that report (which can also be accessed from the Site Analytics > Navigation).
You can choose to view the page in a new window, in Site Editor, or in overlay mode. If you have the appropriate permissions you can Assign Tags. Lastly, you can choose Email Author, which sends email to the person who last published the page.
The Pages report provides a list of the pages visitors viewed most frequently. It shows which pages on your site are most and least popular.
You should take care in how you use this report. You might assume, for example, that the home page will be ranked highest for a new website. Yet, after the site is enhanced and gets more frequent visitors, it might be a concern if the home page continues to be the most frequently visited.
The Entry Pages report shows the pages that visitors see as the first page when entering the website. Monitoring entry pages is important when there is a marketing campaign underway that is intended to point users to a specific page (or pages) within your website. For example, a Google Pay-Per-Click (PPC) campaign might point users to a certain page in your site. In this case, you'd want to know how many users are beginning their site navigation at that page.
The Exit Pages traffic statistics report lists the most common exit pages, which are the pages the user was on when exiting the site. Knowing where visitors are when leaving your site can often point out problems with bad navigation or content. If an unexpected page is moving up on the list of exit pages, iAPPS Analyzer allows a user with Administrator privileges for that content to view or edit the actual content of the page in the Site Editor.
The Pageviews per Visit traffic statistics report shows the average number of pages that were viewed in a visitor session. Presented as a time-series graph, this metric is an important trend to watch as the amount of content on your site grows.
Pageviews per Visit is sometimes referred to as the “stickiness” of a website, since it measures how likely it is that a visitor who finds one page of your website stays on your site to view more pages. If you are using content marketing to try to draw vistiors to the content on your website, this is good.
A large number of pageviews per visit is not always desirable and may sometimes be an indication of ineffective site navigation. It's possible that pageviews are high because a visitor is having trouble finding what they need. If the navigation of your site has changed and the average Pageviews per Visit stays the same, it is possible the change did not have the desired effect.
So along with the number of pages viewed, you may also want to look at one types of pages visitors are looking at. If it is blog or other "attractive" content, that is good. If it is more random, you might want to look at your navigation categories.
The Single Page Visits traffic statistics report shows the number of visitors that came to your site and then left without viewing another page. Sometimes this is referred to as the “bounce rate” of a site. The report lists the bounced pages.
It is helpful to see how this metric changes over time. Most sites expect a visitor to accomplish a task, such as viewing product material, registering for an event, or visiting advertisers. If the number of Single Page Visits is increasing you usually want to do something about it. For example, consider if you purchased a certain amount of search engine Pay Per Clicks. If your overall site traffic went up, but your Single Page Visit metric also increased (especially for the entry page of the click) then you could conclude that the PPC campaign did not work as effectively as it could have. and the landing page would need to be changed.
|
iAPPS is a product of Bridgeline Digital
|
