
iAPPS Analyzer includes a number of analytic reports to help you track your website usage.
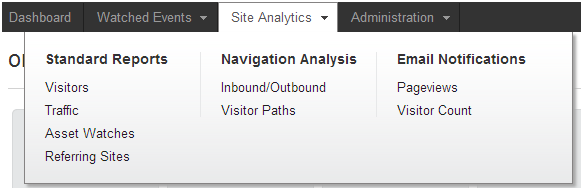
The Site Analytics menu gives you access to a number of reports, navigational analysis and email notifications.
Reports are divided into categories: Visitors, Traffic,
Clicking any of these menus brings you to the Site Analytics screen, which also offers the reports as clickable tab links:
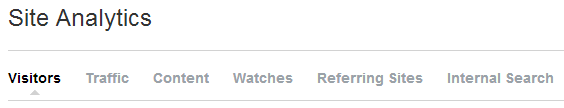
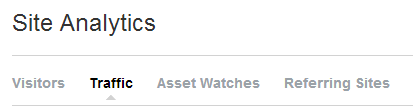
See related sections for details on each type of report.
With iAPPS ds, users who own or manage more than one location or website can sometime group these sites together so that they can access all of their websites, often known as variant sites, with a single user name and sign-on. In this case, they can view the usage statistics for their websites "rolled up" together.
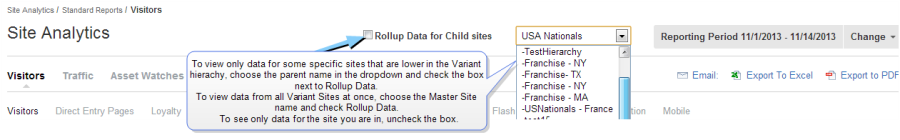
If this is the case for you, you will know if you can do this when you see the option "Rollup Data for Child Sites." in your iAPPS Analyzer screens.
If you are not managing more than one site, you do not need to worry about this. And you can always see the data for any site by switching to that site using the top site switch box in the iAPPS dashboard.
In any reporting screen, choose a Variant grouping and check the box next to "Rollup Data for Child Sites." The information for any site that is lower in the hierarchy that the site chosen will be included in the report. Whatever site is selected in the drop-down, the rollup aggregates any data for any child sites under that one (but not for other child sites). Wherever you are in the hierarchy, the rollup starts there.
For example, if you are in an iAPPS ds installation with large numbers of sites, this will be very helpful both for corporate headquarter in seeing information for large numbers of sites, but also helps franchisees who may own more than one store. If the stores are linked in the hierarchy than the store owner can see all of their data aggregated rather than having to check each site separately.
This function bypasses permissions, so a parent site can see all child site data without having to log in/log out with separate users. However, being able to view more than one site only works for reporting and statistics. Other Analyzer site functions such as watches
iAPPS Analyzer aggregates your website traffic statistics and stores report data. You can then view the data using the tools in Site Analytics.
These reports offer graphical and numerical tools to help you understand how your website traffic is performing. You can view snapshots of site statistics or observe trends at different time intervals.
You can also access the Site Analytics Reports from the Quick Statistics container in the iAPPS Analyzer Control Center.
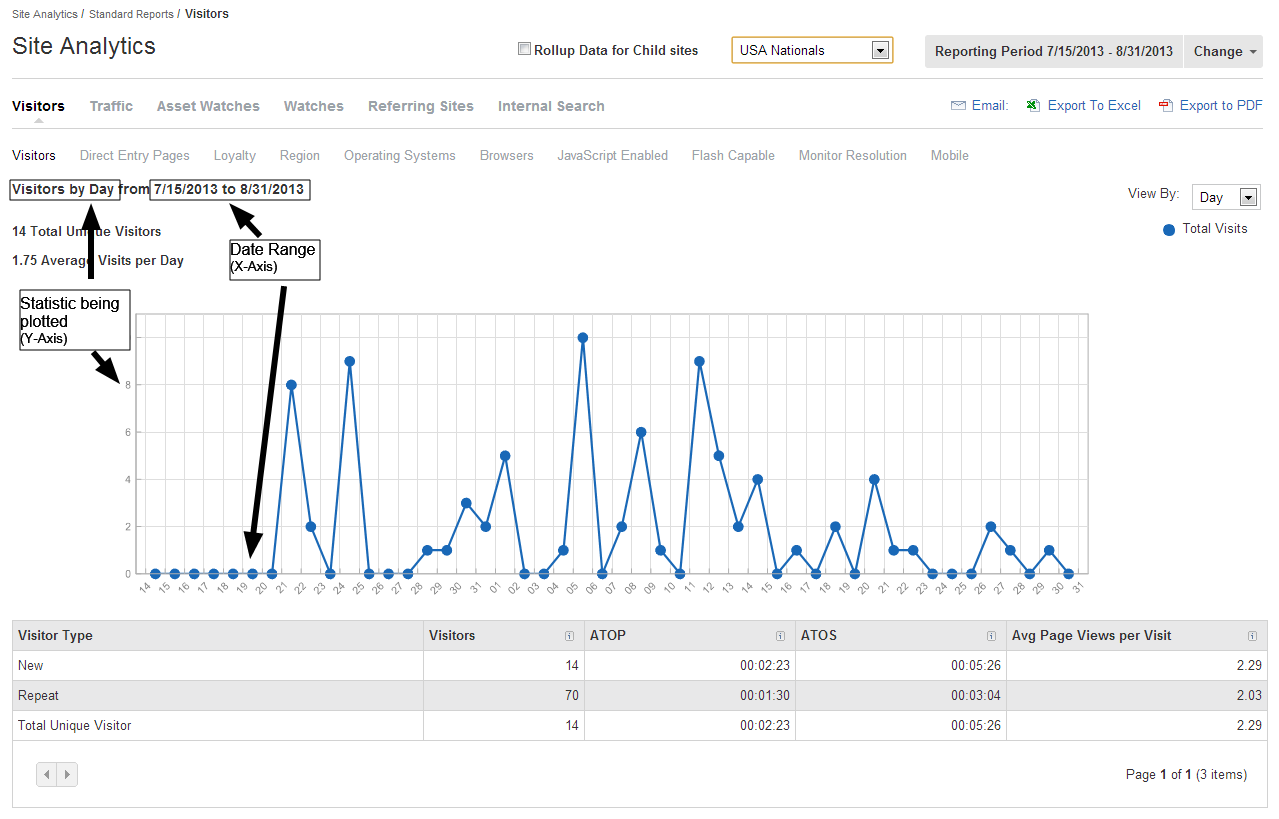
Selecting a report tab automatically runs that report. The plot in the container shows the reporting period on the horizontal axis and the selected statistic or statistic on the vertical axis.
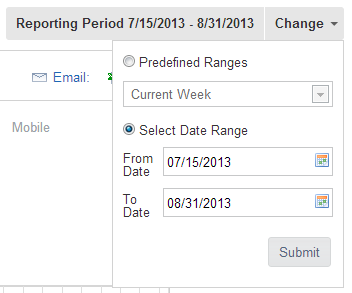
To change the reporting period, click the Change tab in the right-hand column of the container title bar and choose a new date range from the calendar:
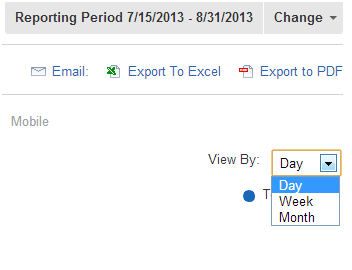
To change the unit of time (Day, week or month) used on the horizontal axis, select a value from the “View By” field in the top right-hand corner:
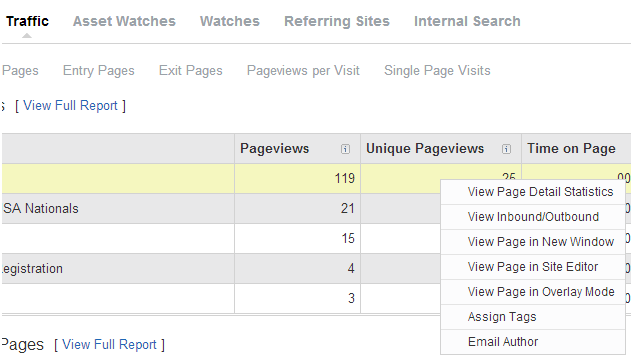
in the Traffic reports section, you can see more information about any web page by right-clicking the table row and selecting a menu item:
For many reports, you may want to view more than one plot on the same graph. For example, if you are analyzing visitor statistics, you may want to compare the visits to specific pages against the total number of site visitors. You can do this with the table at the bottom of the container. To plot the data for a table entry, click on the appropriate row of the table. A legend for the data you just plotted will appear on the main graph:
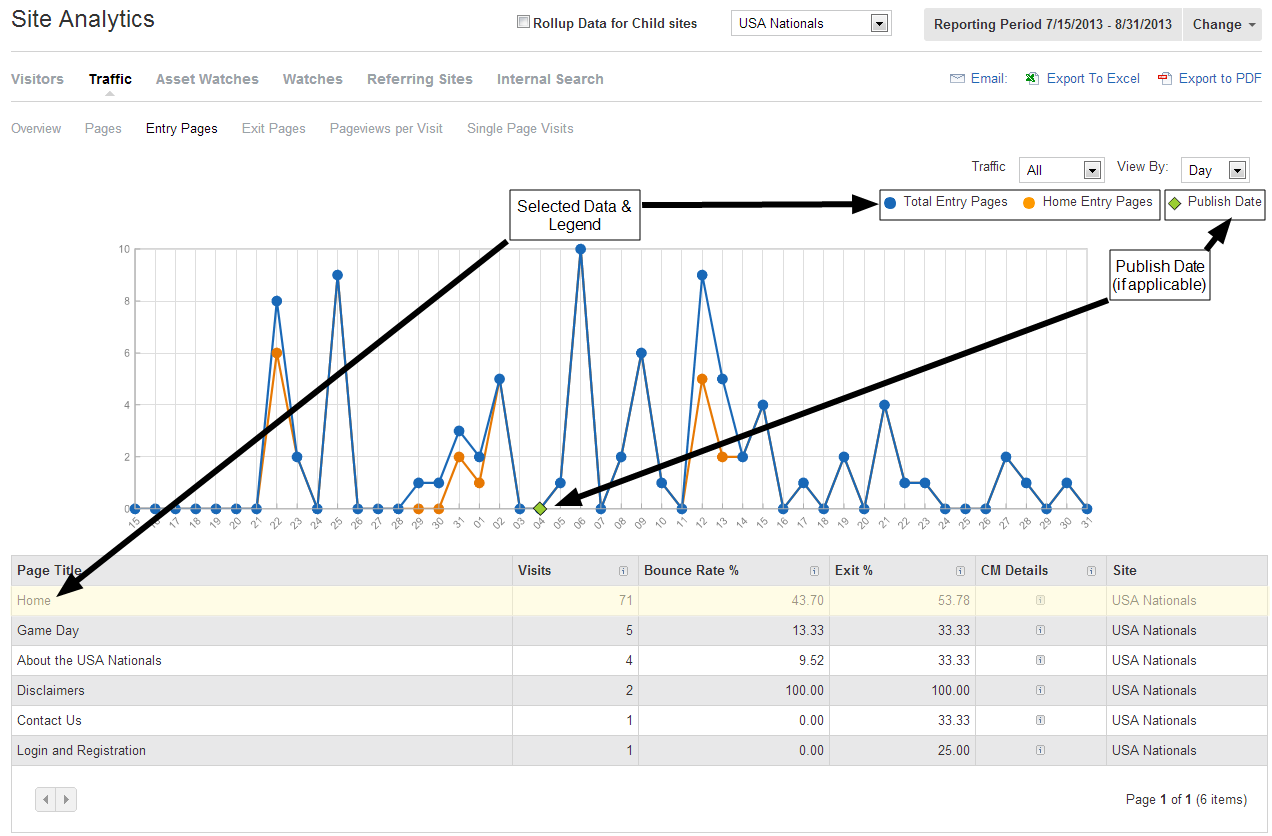
For reports on your website traffic, you may want to see the date on which various pages were published. You can see the impact of publishing a specific page on your overall web traffic with the “Publish Date” item in the legend.
|
iAPPS is a product of Bridgeline Digital
|
