You can analyze whether the goals you have created are on track to be successfully completed. This section shows you how to check your goals against thresholds and if necessary, receive smart recommendations on how to fix your content so that your goals stay on track.
The Top Opportunities container uses the Smart Recommendations Engine to make sure that you can efficiently fix your content so that an underperforming goal will get back on track. This container prioritizes the content work needed to meet your goals by “Severity” and “Level of Effort.” These recommendations are generated from your goal thresholds.
By default, recommendations are presented with content changes that require minimal effort (Level of Effort : Easy) and have maximum impact (Severity: Red) at the top of the list. (You can change this by sorting on the column headers; click the column header to reverse the sort order.)
Example: If visitors are coming to a form and filling out only half of the fields and exiting before they finish the form, you might see an entry “Too many questions on form” in the Issue: Description field of the Top Opportunities container:
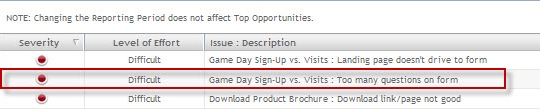
To see details about the issue, right-click the entry and select “View Details and Take Action.” This opens a pop-up Goal Name: Your Goal Name. The Goal Name: Your Goal Name pop-up accesses the Smart Recommendations Engine to generate actionable suggestions:
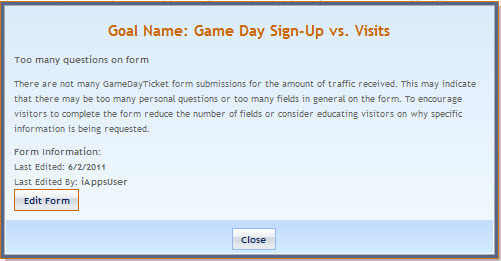
Click “Edit Form” to open the under-performing page in iAPPS Content Manager Site Editori and make the recommended changes.
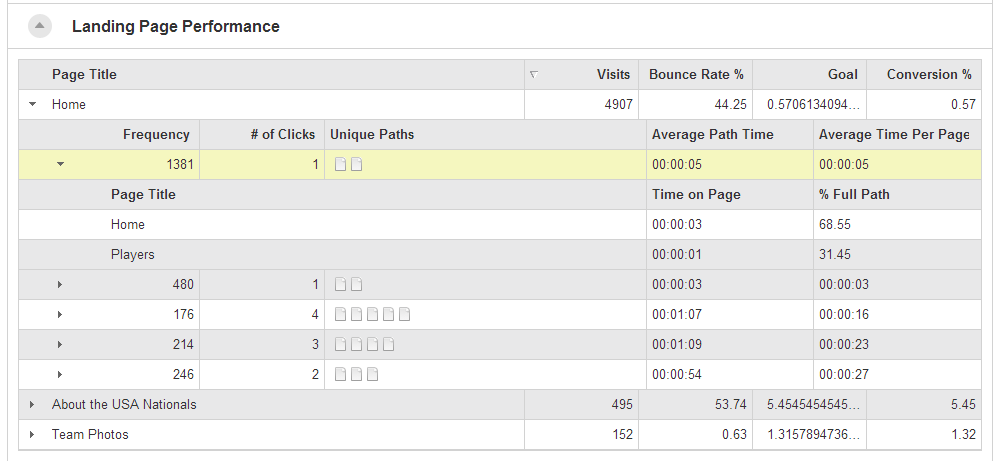
The other two containers on the page are Supplemental Data/Metrics and Landing Page Performance. Together, these two containers tell you how well your campaigns are doing at driving traffic to your site and how well your content is directing visitors on your site.
The Supplemental Data/Metrics container breaks down the site referral traffic from your various campaigns by media channel and displays the analytics data for each channel. The first column shows the type of medium (Emails, Links, Search). The rest of the columns are:
Field | Description |
---|---|
Campaign |
Name of the associated campaign |
Medium |
Type of channel (banner ad, PPC, email) |
Visits |
Total number of visitors arriving via that Campaign, Source, or Medium |
Goal |
Goal completions |
Conversion % |
Varies by Goal. For example, goal completions divided by page visits. |
Bounce Rate |
Percentage of visitors whom arrive on the page from outside the site, then immediately leave without viewing another page. |
The Landing Page Performance container shows analytics for your entry pages.
This container allows you to analyze the paths that visitors are taking through your site and how well your landing pages are driving your goals. The top-level columns for the container are:
Column Header |
Definition |
---|---|
Page title |
Title of your landing page |
Visits |
Total number of visitors arriving at your landing page via that Campaign, Source, or Medium |
Bounce Rate |
Percentage of visitors whom arrive on the page from outside the site, then immediately leave without viewing another page. |
Goal |
Goal completions. |
Conversion % |
Number of goal completions divided by the total number of visits. May vary by goal. |
You can also see additional performance data by expanding the table headers.
Column Header |
Definition |
---|---|
Frequency |
How often visitors come to your landing pages. It is the ratio of the total number of sessions to the total number of unique visitors. |
# of Clicks |
The number of times a visitor follows a hyperlink from one page on your site to another. |
Unique Paths |
The sequence of hyperlinks that visitors follow among pages on your site. |
Average Path Time |
Average time a visitor spends on your website. |
Average Time Per Page |
Average time a visitor spends on a page in a unique path. |
Time on Page |
Average time a visitor spends on a single page. |
% Full Path |
The amount of time a user spends on a single page as a percentage of their total time on the site. |